
Alright, let's talk about what "success" actually looks like for your event. If you want to prove your event was a hit, you need to think beyond just counting heads. We're going to dive into how to define clear goals tied to what your business actually needs and then track the right numbers—like lead quality, how engaged people were, and your return on investment (ROI). This is how you show the real impact of your hard work.
What Does Event Success Really Mean?
Before you can measure anything, you've got to know what you're aiming for. It's easy to get caught up in the excitement of a sold-out venue, but what if none of those people were the right fit for your product? That's not a real win.
True event success isn't just about putting up big, flashy numbers. It’s about hitting specific, meaningful goals that actually help your business grow. This means we need to stop thinking in fuzzy terms like "brand awareness" and start focusing on tangible results. Every single event—whether it's a huge corporate conference, a quick product launch, or a charity fundraiser—needs a clear purpose that connects directly to a business need.
Connecting Your Event to Business Goals
First things first: ask yourself why you're even hosting this event. Your answer to that one question will shape every decision you make, from who you invite to the content you create.
Are you trying to drum up a list of high-quality leads for your sales team? Or is the main point to build stronger relationships with the customers you already have? Maybe you're organizing a gala for a nonprofit, where success is all about the money raised and the new donors you bring on board.
Pinning down this core objective is the absolute foundation of how to measure event success. Without it, you're just collecting random data points without a story to tell.
The global event marketing industry is on track to hit a staggering $722.67 billion by 2028. It's no wonder, especially when you consider that over 80% of organizers say in-person events are their single most effective marketing channel. With that kind of investment on the line, the pressure to prove your event's worth with solid numbers has never been higher. You can dig into more of these industry stats over at Swoogo.
From Big Ideas to Concrete Numbers
Once you’ve got your main goal locked in, it’s time to break it down into things you can actually measure. This is where you connect your grand vision to the real data you'll be collecting on the ground.
To make this super clear, I've put together a table that shows how different event goals translate into specific metrics you should be tracking.
Matching Event Goals to Real Metrics
| Event Goal | What to Track (KPI) | Example of Success |
|---|---|---|
| Generate Sales Leads | # of meetings booked with sales, demo requests, qualified leads passed to sales | You generated 50 qualified leads, and 10 of them booked a follow-up demo right at the event. |
| Boost Customer Loyalty | Attendance rate of current clients, post-event satisfaction scores, new feature adoption | 75% of your top-tier customers attended, and post-event surveys show a 90% satisfaction rate. |
| Raise Funds for a Cause | Total donations collected, # of new recurring donors, average donation size | The event raised $50,000, and you signed up 25 new monthly donors. |
| Increase Brand Awareness | Social media mentions & reach, press clippings, website traffic spike | Your event hashtag was used 1,000+ times, leading to a 30% jump in website visitors during event week. |
This framework isn't just about collecting data for the sake of it. It’s about making sure every single number you track tells a part of your success story. For example, if your goal is fundraising, exploring different charity event ideas can directly impact the metrics you see in the "funds raised" column.
By linking your goals directly to what you measure, you avoid getting lost in a sea of impressive-sounding but ultimately meaningless stats. Instead, you get a clear, powerful way to prove your event's true value.
Choosing KPIs That Tell the True Story
Okay, so you've nailed down your event goals. What's next? It's time to pick the right Key Performance Indicators (KPIs) to actually track your progress. Think of KPIs as the individual storylines that, together, tell you if your event was a blockbuster hit or a box-office flop.
Just counting the number of people who showed up is like only reading the first chapter of a book—you miss the whole plot. To really get what's going on, you have to dig deeper. The trick is to separate the meaningful insights from the noisy, distracting numbers. This is where you learn how to measure event success like a pro.
Moving Beyond Headcounts
The raw number of attendees is the oldest metric in the book, but honestly, it can be pretty misleading. A sold-out event where nobody was paying attention or connecting? I wouldn't call that a win. Instead, you need to focus on metrics that reveal the quality of your audience and how much they actually participated.
A great place to start is the registrant-to-attendee ratio. If 1,000 people signed up but only 300 actually came, that's a huge red flag. Was your marketing message off? Was the time or date a total bust? This one number tells you a ton about how well your promotion worked and how committed your audience really is.
Another KPI I love, especially for conferences or workshops with multiple sessions, is session dwell time. Knowing attendees stuck around for a whole 45-minute panel instead of bailing after 10 minutes is a gold-star indicator that your content was hitting the mark.
The best event organizers I know are now obsessed with KPIs that tie directly to business goals. They're tracking things like post-event on-demand views, the number of sales deals influenced, and the event's direct contribution to the revenue pipeline. It's a massive shift that proves actionable data is what drives future strategies and, more importantly, secures next year's budget.
Blending Numbers with Feelings
The most complete picture of success comes from mixing the hard data with human feedback. Numbers tell you what happened, but your attendees tell you why it happened. You absolutely need both.
-
Quantitative KPIs (The "What"): These are your solid, measurable numbers.
- Meetings Booked: How many one-on-one meetings got scheduled between attendees, sponsors, and your own sales team? This is a concrete networking metric.
- Leads Generated: Simple and powerful. How many new contacts did you add to your sales funnel?
- Cost Per Lead: This is the magic number for proving value to the finance team. To nail this, you need a meticulous event budget template to track every penny.
-
Qualitative KPIs (The "Why"): These metrics get into the heads and hearts of your attendees.
- Net Promoter Score (NPS): That classic "How likely are you to recommend us?" question is still one of the best ways to gauge overall satisfaction and loyalty in a single score.
- Post-Event Survey Feedback: Go beyond the 1-5 scales. Ask open-ended questions like, "What was the most valuable part of the event for you?" to uncover gems you'd never think to ask about.
Understanding how your attendees feel is just as important as counting them. For a deeper look at how this impacts your business, check out this great resource on Measuring Client Satisfaction for Business Growth.
When you combine both types of data, you get a full 360-degree view of your event's performance. That's the kind of powerful intelligence that lets you prove your event's worth and plan an even better one next time.
Smart Ways to Collect Event Data

Okay, so you know what success looks like. Now, how do you actually gather the information to prove it? You can't measure what you don't collect, and getting this part right is everything when it comes to accurately measuring your event's success.
The good news? You don't need a PhD in data science. Most of the best data collection methods are already baked into the tools you’re likely using. It's really just about knowing where to look and what to ask, without making your attendees feel like they're part of a science experiment.
Make Your Event Tech Work for You
Your Event Management System (EMS) is so much more than a glorified ticket booth—it’s a data goldmine. These platforms are built to follow the entire attendee journey, handing you a treasure trove of information from the moment someone registers to their post-event feedback.
It's no surprise the industry relies heavily on this tech. A whopping 79% of event professionals use an EMS to streamline their planning and grab that essential data. And looking ahead, about 50% of them plan to integrate AI into their events to get even sharper insights, according to stats from Eventgroove.
Your platform is likely already tracking killer metrics for you, such as:
- Registration Sources: Pinpoint which marketing channels—email, social media, paid ads—are actually bringing people in.
- Ticket Sales Over Time: See exactly when people are buying tickets so you can nail your promotional timing for the next event.
- Attendee Demographics: Get a clear picture of who's showing up by looking at their job titles, industries, and locations.
My Pro Tip: Before you sign on the dotted line with any event tech provider, demand a full demo of their analytics dashboard. If it's clunky, confusing, or doesn't track the specific KPIs you need, walk away. It doesn't matter how slick the sales pitch is if the tool can't deliver the goods.
Crafting Surveys People Actually Finish
We’ve all been there—staring at a post-event survey that’s a mile long and feels like a chore. Most of us just close the tab. The secret to getting feedback you can actually use is to create surveys that are short, to the point, and feel valuable to the attendee.
Seriously, keep it to 5-7 essential questions, max. Kick things off with a high-level satisfaction question like the Net Promoter Score (NPS). From there, ask a couple of targeted multiple-choice questions about key parts of the event, like the venue, speakers, or networking opportunities.
Finally, wrap up with one or two open-ended questions. This is where you get the gold. Simple questions like, "What was the most memorable part of the event for you?" or "What's one thing we could do better next time?" provide insights you’d never get from a checkbox.
Track Engagement in the Moment
Don't wait until the event is over to see what’s resonating. For live events, you can capture real-time engagement data with some pretty simple tech.
QR codes are a fantastic, low-cost way to do this. I like to place them at sponsor booths, at the entrance to breakout sessions, or even on networking tables. A quick scan can track booth traffic or let an attendee instantly download a speaker's slide deck. It's a win-win.
For bigger conferences, RFID (Radio-Frequency Identification) wristbands or badges are the next level. They automatically track which sessions people attend and how long they stay, giving you powerful, passive data on which content truly captured your audience's attention. These are just a couple of the many practical event planning tips that can take your data collection from good to great.
Proving Your Event's ROI and Business Impact
Alright, this is where the rubber meets the road. You’ve got your attendance numbers, survey feedback, and social media stats. Now it's time to translate all that data into something the C-suite really understands: the bottom line. Proving your event's Return on Investment (ROI) is how you show everyone that your event wasn't just a fun get-together—it was a strategic business move.
I know that calculating event ROI can sound a little daunting, but the core idea is pretty simple. You’re just weighing what the business gained against what you spent to make it all happen. Getting this right is the final, crucial piece of the puzzle.
Calculating Your Event ROI
At its heart, the ROI formula is straightforward:
((Total Event Revenue – Total Event Cost) / Total Event Cost) x 100 = Event ROI (%)
The "Total Event Cost" is the easy part. Just add up everything you spent—venue, catering, speaker fees, marketing, you name it. The "Total Event Revenue" is where you get to show off the real value. This goes way beyond just ticket sales.
Think about all the value your event generated:
- Direct Revenue: This is the obvious stuff, like ticket sales, sponsorships, and exhibitor fees.
- Pipeline Influence: What's the total dollar value of all the sales opportunities (leads) that came directly from the event?
- Converted Leads: This is the actual cash in the bank from deals that have closed because of your event.
To really build a strong case, you need to be fluent in these different financial metrics. If you want to dig deeper, there are some great proven strategies for measuring event ROI that can help you make an undeniable argument for your event's financial impact.
A Real-World ROI Scenario
Let's walk through a quick, real-world example. Say you ran a conference to launch a new product for potential clients.
Here’s a look at how the numbers might shake out initially.
Real-World Event ROI Calculation Example
| Item | Calculation/Value | Notes |
|---|---|---|
| Total Event Costs | $40,000 | Includes venue, tech, marketing, staff, etc. |
| New Sales Pipeline | $150,000 | Value of deals generated from event leads. |
| Lead Conversion Rate | 20% | Based on your historical sales data. |
| Event-Attributed Revenue | $30,000 | This is 20% of the $150,000 pipeline. |
| ROI Calculation | (($30,000 – $40,000) / $40,000) x 100 | Plugging the numbers into the formula. |
| Final ROI | -25% | Wait, a negative ROI? What gives? |
Seeing a -25% ROI can make your heart sink, but don't panic! This is actually a perfect example of why long-term tracking is so important. Sales cycles, especially for big-ticket items, take time. This calculation only reflects the deals that closed right away.
What happens if you keep tracking those leads? If you close another $50,000 in business over the next six months, your ROI jumps from -25% to a fantastic 100%. That’s a completely different story to tell your boss.
Measuring the Intangible Wins
Of course, not every win comes with a neat price tag. Things like a surge in brand awareness, positive media mentions, or strengthened client relationships are incredibly valuable, even if they don't fit into a spreadsheet. Don't ignore these "soft" metrics—they're a huge part of your event's overall success story.
The infographic below shows a simple way to think about collecting the feedback that fuels these insights.
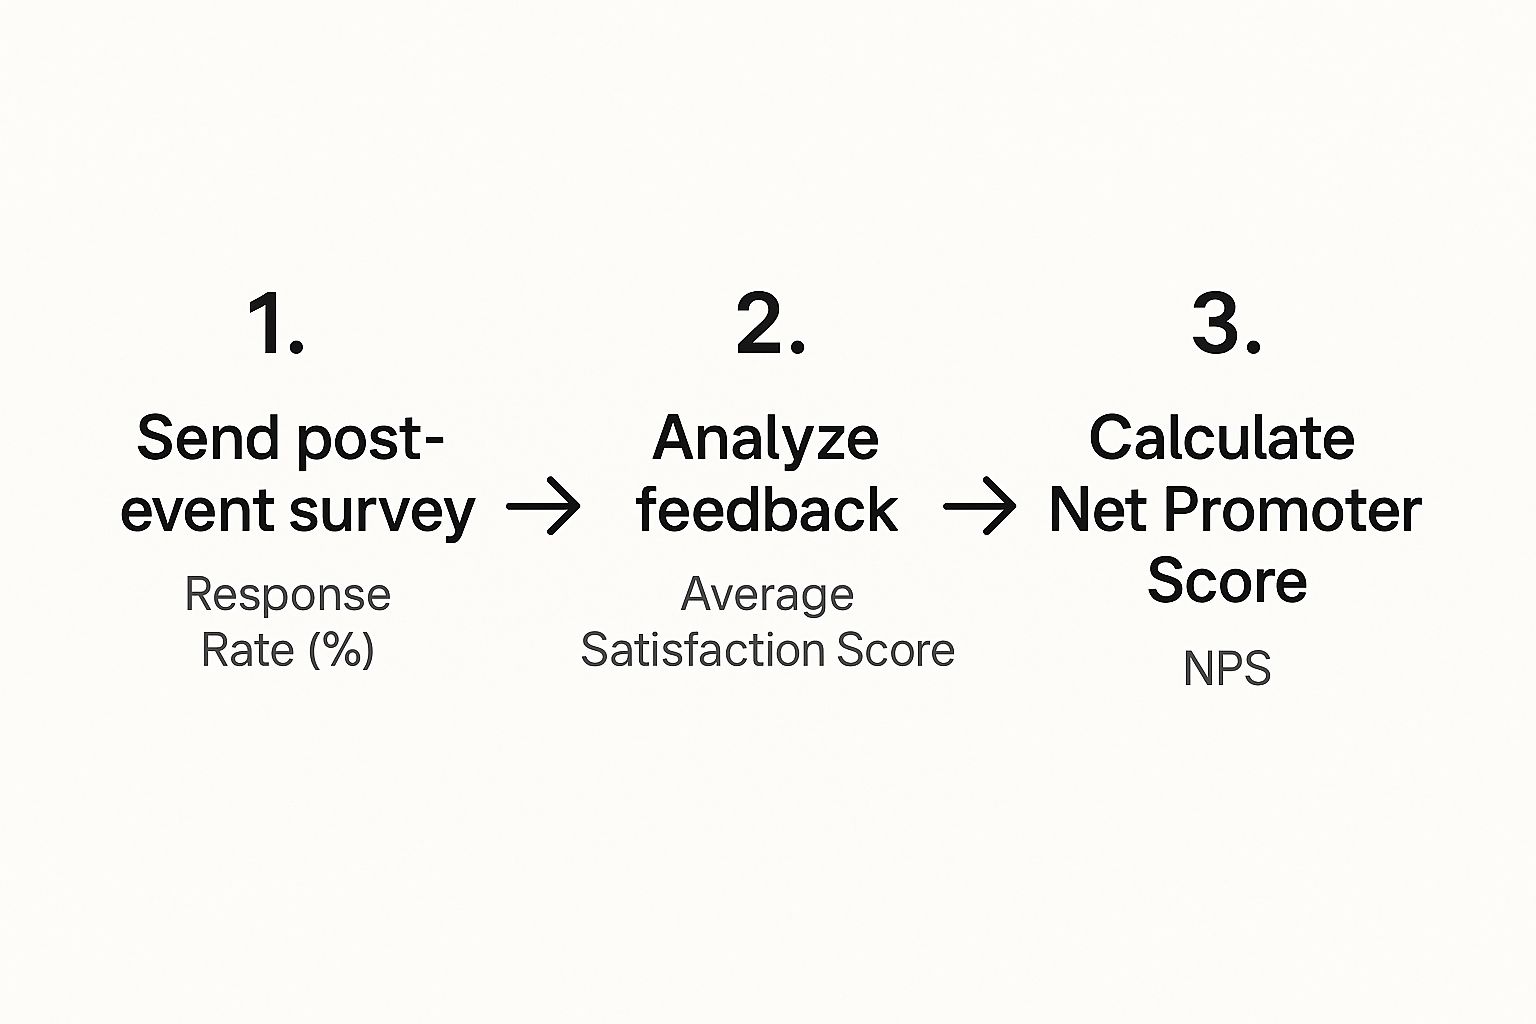
This kind of process helps you turn feelings and opinions into concrete data points, like an Average Satisfaction Score or a Net Promoter Score (NPS). These metrics are gold for showing brand health and loyalty. This is especially true for cause-driven events, which is a key part of smart https://1021events.com/non-profit-event-planning/.
When you combine the hard financial ROI with these powerful intangible wins, you’re not just sharing data—you're telling the complete, compelling story of your event's total business impact.
Turning Data Into Your Next Big Win
Alright, you’ve gathered a mountain of data. Now for the fun part. Collecting stats is one thing, but the real win comes from turning those raw numbers and survey comments into a story—a story that proves your event’s value and, just as importantly, tells you exactly what to do next.
This is how you stop just reporting on what happened and start strategically planning your next success.
A good post-event report isn't just a data dump; it's a persuasive narrative. Your job is to create something that clicks with everyone, from the marketing folks who need audience insights to the leadership team looking at the bottom line. It’s your moment to show not just what you did, but why it was a big deal.
Building Your Post-Event Report
Think of your report as your event's highlight reel and strategic playbook rolled into one. You need to boil down all that information into clear, easy-to-digest takeaways that make the case for the budget you spent and give you a clear path forward.
Kick things off by stacking your achievements right up against your original goals. Did you aim for 50 qualified leads and end up with 65? That’s your headline. Framing the report around these wins from the get-go grabs everyone's attention.
Next, make your data visual. Seriously, no one wants to squint at a spreadsheet. Simple, clean charts and graphs are your best friends here for telling the story at a glance:
- Bar Charts: Perfect for a quick comparison, like showing registration numbers versus actual attendance or which breakout session was the most popular.
- Pie Charts: Awesome for breaking down your audience demographics. Who were they? Think job titles, industries, or even how they found out about you.
- Line Graphs: The best way to show a trend over time. You can map out the buzz on social media leading up to and during the event, or track the pace of ticket sales.
Using visuals means your key points will hit home instantly, without anyone getting lost in the weeds.
From Insights to Actionable Recommendations
This is where the magic really happens. The most valuable part of your report isn't just stating what happened—it’s explaining what you should do about it. This is where your expertise shines as you connect the dots for everyone.
Don't just show the numbers; tell them what the numbers mean. If your surveys reveal that attendees went wild for the networking breaks but felt the keynote fell flat, your recommendation isn't simply "get a better keynote speaker." It’s "shift some of the speaker budget toward creating more of those structured networking sessions that our audience clearly loved."
This section should be packed with practical, forward-thinking advice. For example, if your data shows a lot of people registered but didn't show up, you might recommend a stronger pre-event email campaign to keep the energy high.
This whole process creates a feedback loop for continuous improvement. Every event teaches you something, setting new benchmarks for the next one. You’re not just proving you were successful; you’re building the blueprint for future growth. Honestly, this analytical mindset is a huge part of learning how to plan a successful event again and again.
Your Top Questions About Measuring Event Success, Answered
Even with a rock-solid plan, you're bound to have questions when it's time to actually measure your event's success. It’s a pretty complex process with a lot of moving parts. Let's walk through some of the most common questions we get, so you can feel confident building out your own strategy.
When Should I Start Measuring Event Success?
The simple answer? Immediately. But the full story takes a bit longer to unfold.
Some metrics give you an instant read on how things are going. Think about tracking attendance numbers, real-time session feedback, and how many people are using your event hashtag on social media. These are great for getting a quick pulse check right as the event is happening or just after it wraps up.
However, the really juicy metrics—the ones that your boss actually cares about, like lead conversions and ROI—don't pop up overnight. Sales cycles can be long and winding. You'll likely need a good three to six months to see the true business impact. The key is to plan from day one to track both the immediate buzz and the long-term business wins.
What's the Biggest Mistake People Make When Measuring Events?
Hands down, the single biggest mistake we see is getting hung up on vanity metrics. These are the flashy numbers that look great on a slide but don't tell you a thing about real business impact. We're talking about things like the total number of people who registered or how many "likes" a social media post got.
A truly effective measurement strategy cuts through the fluff. It focuses squarely on KPIs that tie directly back to your core business goals. Proving your event influenced the sales pipeline or increased the lifetime value of customers who attended—that’s what shows real contribution.
Focusing on these deeper metrics is what separates a decent event report from a great one. It completely changes the conversation from "How many people showed up?" to "How much business did we generate?"
How Is Measuring a Virtual Event Different from an In-Person One?
While your main business goals probably won't change, the specific data points you track absolutely will shift depending on the event format. With virtual events, you're sitting on a goldmine of digital data.
For a virtual event, you'll want to zoom in on things like:
- Poll answers and Q&A participation: This shows you who was leaning in and engaging with the content.
- Resources downloaded: A great indicator of which topics or speakers really hit home.
- Session replay views: This measures the long-tail interest and tells you which content is worth repurposing.
For in-person events, the focus shifts to what's happening in the room. You'll be measuring things like booth traffic, connections made using the event app, and the number of one-on-one meetings your sales team managed to book. The trick is to pick the right metrics for the specific experience you've created, while always tying them back to your main objectives.
How Can I Measure Something Squishy Like Brand Awareness?
Brand awareness might feel a little fuzzy, but you can absolutely measure it with hard numbers. You just have to get creative and pull a few different data points together to paint the full picture.
Start by tracking the volume of social media mentions about your brand and event. More importantly, analyze the sentiment—are people saying positive things?
Next, take a look at your website traffic. Did you get a nice spike in visits from new users during your event promotion? You can also track media mentions and press clippings. Finally, just ask! Add a direct question to your post-event survey, like asking attendees how their perception of your brand changed after the event. By weaving these different threads together, you can clearly show how your event moved the needle on brand visibility.
Planning an event and want to make sure every detail drives success? The experts at 1021 Events specialize in creating unforgettable experiences, from professional DJ/MC services and high-quality sound to stunning videography with aerial drone coverage. We'll help you craft a memorable occasion that hits all your goals. Find out more about how we can help.

